管理节点
Logging
By default the node log files are stored to the logs subdirectory of the working directory and are rotated from time
to time. You can have logging printed to the console as well by passing the --log-to-console command line flag.
The default logging level is INFO which can be adjusted by the --logging-level command line argument. This configuration
option will affect all modules. Hibernate (the JPA provider used by Corda) specific log messages of level WARN and above
will be logged to the diagnostic log file, which is stored in the same location as other log files (logs subdirectory
by default). This is because Hibernate may log messages at WARN and ERROR that are handled internally by Corda and do not
need operator attention. If they do, they will be logged by Corda itself in the main node log file.
默认的,节点的 log 文件会存储在工作目录下的 logs 子目录中,并且会随时的更新。你可以通过传入 `--log-to-console 命令行参数来同样将日志打印在 console 中。默认的日志等级是 INFO,可以通过 --logging-level 命令行参数来调整。这个配置选项会影响所有的模块。
It may be the case that you require to amend the log level of a particular subset of modules (e.g., if you’d like to take a
closer look at hibernate activity). So, for more bespoke logging configuration, the logger settings can be completely overridden
with a Log4j2 configuration file assigned to the log4j.configurationFile system property.
有时候你可能想针对某个模块的 subset 变更 log 级别(比如你想更详细地查看 Hibernate activity)。所以,对于更加定制的 logging 配置,logger 的配置可以用分配给 log4j.configurationFile 系统属性一个 Log4j2 配置文件的通过 更多的自定义 logging,可以通过将一个 Log4j2 配置文件来彻底重写 logger 的设置。
The node is using log4j2 asynchronous logging by default (configured via log4j2 properties file in its resources)
to ensure that log message flushing is not slowing down the actual processing.
If you need to switch to synchronous logging (e.g. for debugging/testing purposes), you can override this behaviour
by adding -DLog4jContextSelector=org.apache.logging.log4j.core.selector.ClassLoaderContextSelector to the node’s
command line or to the jvmArgs section of the node configuration (see 节点的配置).
Example
Create a file sql.xml in the current working directory. Add the following text :
在当前的工作目录中创建一个 sql.mxl 文件:
<?xml version="1.0" encoding="UTF-8"?>
    <Configuration status="WARN">
        <Appenders>
            <Console name="Console" target="SYSTEM_OUT">
                <PatternLayout pattern="%d{HH:mm:ss.SSS} [%t] %-5level %logger{36} - %msg%n"/>
            </Console>
        </Appenders>
        <Loggers>
            <Logger name="org.hibernate" level="debug" additivity="false">
                <AppenderRef ref="Console"/>
            </Logger>
            <Root level="error">
                <AppenderRef ref="Console"/>
            </Root>
        </Loggers>
    </Configuration>
Note the addition of a logger named org.hibernate that has set this particular logger level to debug.
注意一个额外的名为 org.hibernate 的 logger 设置了指定的 logger level 为 debug。
Now start the node as usual but with the additional parameter log4j.configurationFile set to the filename as above, e.g.
像常规一样启动节点,但是带有一个额外的参数 log4j.configurationFile,指向上边的文件名
java <Your existing startup options here> -Dlog4j.configurationFile=sql.xml -jar corda.jar
To determine the name of the logger, for Corda objects, use the fully qualified name (e.g., to look at node output
in more detail, use net.corda.node.internal.Node although be aware that as we have marked this class internal we
reserve the right to move and rename it as it’s not part of the public API as yet). For other libraries, refer to their
logging name construction. If you can’t find what you need to refer to, use the --logging-level option as above and
then determine the logging module name from the console output.
为了确定 logger 的名字,对于 Corda 对象,使用完全合格的名字,fully qualified name(比如为了查看节点的 output 更详细的信息,可以使用 net.corda.node.internal.Node,但是要知道我们给这个类标记为 internal,我们保留移动或者改变名字的权利因为他还不是公开 API 的一部分)。对于其他的类库,参考他们的 logging 名字结构。如果你找不到你需要参考什么,像上边那样使用 --logging-level 选项然后从 console 的 output 中确定 logging 模块的名字。
SSH access
Node can be configured to run SSH server. See Node shell for details.
数据库访问
When running a node backed with a H2 database, the node can be configured to expose the database over a socket (see 访问 H2 数据库).
Note that in production, exposing the database via the node is not recommended.
监控你的节点
Like most Java servers, the node can be configured to export various useful metrics and management operations via the industry-standard JMX infrastructure. JMX is a standard API for registering so-called MBeans … objects whose properties and methods are intended for server management. As Java serialization in the node has been restricted for security reasons, the metrics can only be exported via a Jolokia agent.
像大多数的 Java servers 一样,节点通过业界标准的 JMX infrastructure 暴露了很多有用的 metrics 和管理维护方法。JMX 是一个标准的 API,通常被称为 MBeans… 对象,它的属性和方法通常被用来进行 server 管理。为了 export,它不需要任何指定的网络协议。所以从节点中可以使用多种方式来导出数据:一些监控系统提供一个“Java Agent”,它是一个查找所有的 MBeans 并且通过网络向他们发送一个统计数据搜集器(statistics collector)的 JVM plugin。对于这些系统,按照 vendor 提供的指导去使用他们。
Jolokia allows you to access the raw data and operations without connecting to the JMX port
directly. Nodes can be configured to export the data over HTTP on the /jolokia HTTP endpoint, Jolokia defines the JSON and REST
formats for accessing MBeans, and provides client libraries to work with that protocol as well.
Jolokia 允许你不需要直接连接 JMX port 就可以访问 raw data 和维护操作。节点通过 HTTP 在 /jolokia HTTP endpoint 上导出数据,Jolokia 定义了 JSON 和 REST 格式来访问 MBeans,也提供了客户端类库来跟这个协议一同工作。
Here are a few ways to build dashboards and extract monitoring data for a node:
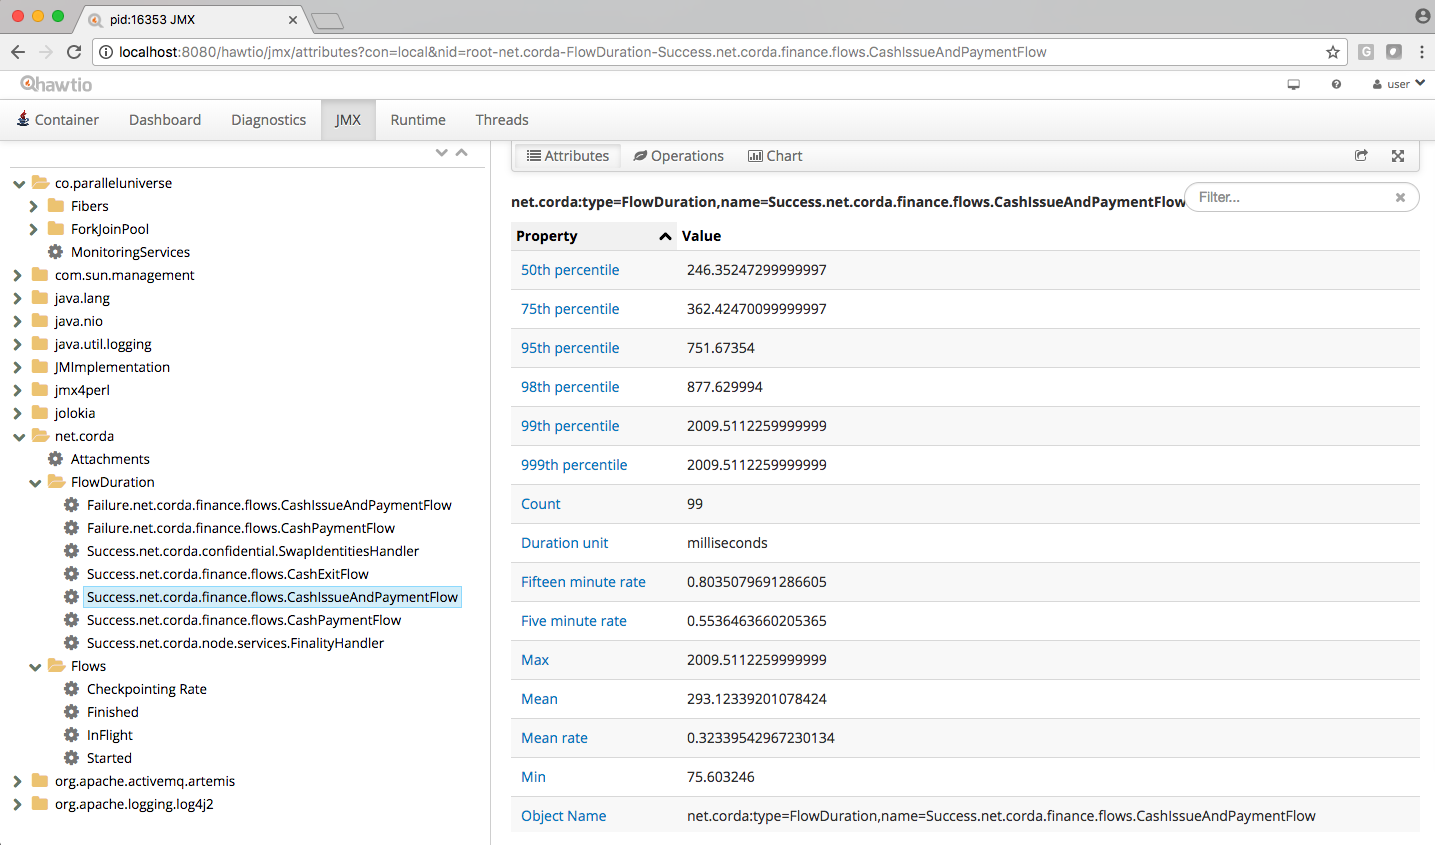
- Hawtio is a web based console that connects directly to JVM’s that have been instrumented with a jolokia agent. This tool provides a nice JMX dashboard very similar to the traditional JVisualVM / JConsole MBbeans original.
- JMX2Graphite is a tool that can be pointed to /monitoring/json and will scrape the statistics found there, then insert them into the Graphite monitoring tool on a regular basis. It runs in Docker and can be started with a single command.
- JMXTrans is another tool for Graphite, this time, it’s got its own agent (JVM plugin) which reads a custom config file and exports only the named data. It’s more configurable than JMX2Graphite and doesn’t require a separate process, as the JVM will write directly to Graphite.
- Cloud metrics services like New Relic also understand JMX, typically, by providing their own agent that uploads the data to their service on a regular schedule.
- Telegraf is a tool to collect, process, aggregate, and write metrics. It can bridge any data input to any output using their plugin system, for example, Telegraf can be configured to collect data from Jolokia and write to DataDog web api.
有以下几种方式来创建 dashboard 并导出节点的监控数据:
- Hawtio 是一个基于 web 的 console,能够直接同使用 jolokia agent 的 JVM 连接。这个工具提供给了一个非常好的 JMX dashboard,跟传统的 JVisualVM/JConsole MBbenas original 很像。
- JMX2Graphite 是一个工具,可以用来指定/监控/json 并获得指标数据,然后将他们定期地插入到 Graphite 监控工具。它在 Docker 中运行,并且可以通过一个简单的命令来启动。
- JMXTrans 是对 Graphite 的另外一个工具,它会有一个自己的 agent(JVM plugin),用来读取一个自定义的 config 文件并且只导出 named data。相对于 JMX2Graphite 它更具有可配置性,并且不需要一个单独的 process,因为 JVM 会直接向 Graphite 中写入。
- Cloud metrics service 像 New Relic 同样理解 JMX,通常会提供他们自己的 agent,按照常规的计划来将数据上传到他们的服务中。
- Telegraf 是一个工具,来搜集、处理、聚合并且书写 metrics。它可以使用他们的 plugin 系统连接任何的数据输入和输出,比如 Telegraf 能够被配置来从 Jolokia 搜集数据,然后写到 DataDog web api。
The Node configuration parameter jmxMonitoringHttpPort has to be present in order to ensure a Jolokia agent is instrumented with the JVM run-time.
节点的配置参数 jmxMonitoringHttpPort 应该被设置来确保一个 Jolokia 代理会带有 JVM run-time。
The following JMX statistics are exported:
- Corda specific metrics: flow information (total started, finished, in-flight; flow duration by flow type), attachments (count)
- Apache Artemis metrics: queue information for P2P and RPC services
- JVM statistics: classloading, garbage collection, memory, runtime, threading, operating system
下边的 JMX statistics 可以被导出:
- Corda 指定的 metrics:flow 信息(总共开始的、结束的、in-flight 的 flow,不同 flow type 的 flow duration)
- Apache Artemis metrics:P2P 和 RPC 服务的 queue 信息
- JVM statistics:classloading、垃圾回收、内存、runtime、线程、操作系统
Notes for production use
When using Jolokia monitoring in production, it is recommended to use a Jolokia agent that reads the metrics from the node and pushes them to the metrics storage, rather than exposing a port on the production machine/process to the internet.
Also ensure to have restrictive Jolokia access policy in place for access to production nodes. The Jolokia access is controlled
via a file called jolokia-access.xml.
Several Jolokia policy based security configuration files (jolokia-access.xml) are available for dev, test, and prod
environments under /config/<env>.
Notes for development use
When running in dev mode, Hibernate statistics are also available via the Jolkia interface. These are disabled otherwise
due to expensive run-time costs. They can be turned on and off explicitly regardless of dev mode via the
exportHibernateJMXStatistics flag on the database configuration.
When starting Corda nodes using Cordformation runner (see Running nodes locally), you should see a startup message similar to the following: Jolokia: Agent started with URL http://127.0.0.1:7005/jolokia/
When starting Corda nodes using the ‘driver DSL’, you should see a startup message in the logs similar to the following: Starting out-of-process Node USA Bank Corp, debug port is not enabled, jolokia monitoring port is 7005 {}
The following diagram illustrates Corda flow metrics visualized using hawtio:
内存使用和优化
All garbage collected programs can run faster if you give them more memory, as they need to collect less frequently. As a default JVM will happily consume all the memory on your system if you let it, Corda is configured with a 512mb Java heap by default. When other overheads are added, this yields a total memory usage of about 800mb for a node (the overheads come from things like compiled code, metadata, off-heap buffers, thread stacks, etc).
对所有的垃圾搜集程序来说,如果你给他们更多的内存他们会运行的更快,因为他们会更少地需要去搜集。默认的如果你让 JVM 消耗掉你系统中的所有内存的话,那么 JVM 会很愿意那样去做的,Corda 默认会设置为相对比较小的 512mb Java heap。当其他的部分也在消耗内存的时候,一个节点的内存的总体使用量大概会在 800mb 左右(这些消耗可能来自于编译代码、metadata、off-heap buffers、线程栈等)。
If you want to make your node go faster and profiling suggests excessive GC overhead is the cause, or if your node is running out of memory, you can give it more by running the node like this:
如果你希望你的节点更快并且想要超过 GC 最大值的话,或者你的节点出现了 out of memory 的问题,你可以用下边的参数给节点分配更多的内存:
java -Dcapsule.jvm.args="-Xmx1024m" -jar corda.jar
The example command above would give a 1 gigabyte Java heap.
这个例子命令会提供一个 1 gigabyte Java heap。
注解
Unfortunately the JVM does not let you limit the total memory usage of Java program, just the heap size.
注解
JVM 不会允许你限制被 Java 程序所使用的内存,仅仅允许你可以修改 heap size。
Hiding sensitive data
A frequent requirement is that configuration files must not expose passwords to unauthorised readers. By leveraging environment variables, it is possible to hide passwords and other similar fields.
Take a simple node config that wishes to protect the node cryptographic stores:
myLegalName = "O=PasswordProtectedNode,OU=corda,L=London,C=GB"
keyStorePassword = ${KEY_PASS}
trustStorePassword = ${TRUST_PASS}
p2pAddress = "localhost:12345"
devMode = false
 networkServices {
    doormanURL = "https://cz.example.com"
    networkMapURL = "https://cz.example.com"
}
By delegating to a password store, and using command substitution it is possible to ensure that sensitive passwords never appear in plain text.
The below examples are of loading Corda with the KEY_PASS and TRUST_PASS variables read from a program named corporatePasswordStore.
Bash
KEY_PASS=$(corporatePasswordStore --cordaKeyStorePassword) TRUST_PASS=$(corporatePasswordStore --cordaTrustStorePassword) java -jar corda.jar
警告
If this approach is taken, the passwords will appear in the shell history.
Windows PowerShell
$env:KEY_PASS=$(corporatePasswordStore --cordaKeyStorePassword); $env:TRUST_PASS=$(corporatePasswordStore --cordaTrustStorePassword); java -jar corda.jar
For launching on Windows without PowerShell, it is not possible to perform command substitution, and so the variables must be specified manually, for example:
SET KEY_PASS=mypassword & SET TRUST_PASS=mypassword & java -jar corda.jar
警告
If this approach is taken, the passwords will appear in the windows command prompt history.
Backup recommendations
Various components of the Corda platform read their configuration from the file system, and persist data to a database or into files on disk. Given that hardware can fail, operators of IT infrastructure must have a sound backup strategy in place. Whilst blockchain platforms can sometimes recover some lost data from their peers, it is rarely the case that a node can recover its full state in this way because real-world blockchain applications invariably contain private information (e.g., customer account information). Moreover, this private information must remain in sync with the ledger state. As such, we strongly recommend implementing a comprehensive backup strategy.
The following elements of a backup strategy are recommended:
Database replication
When properly configured, database replication prevents data loss from occurring in case the database host fails. In general, the higher the number of replicas, and the further away they are deployed in terms of regions and availability zones, the more a setup is resilient to disasters. The trade-off is that, ideally, replication should happen synchronously, meaning that a high number of replicas and a considerable network latency will impact the performance of the Corda nodes connecting to the cluster. Synchronous replication is strongly advised to prevent data loss.
Database snapshots
Database replication is a powerful technique, but it is very sensitive to destructive SQL updates. Whether malicious or unintentional, a SQL statement might compromise data by getting propagated to all replicas. Without rolling snapshots, data loss due to such destructive updates will be irreversible. Using snapshots always implies some data loss in case of a disaster, and the trade-off is between highly frequent backups minimising such a loss, and less frequent backups consuming less resources. At present, Corda does not offer online updates with regards to transactions. Should states in the vault ever be lost, partial or total recovery might be achieved by asking third-party companies and/or notaries to provide all data relevant to the affected legal identity.
File backups
Corda components read and write information from and to the file-system. The advice is to backup the entire root directory of the component, plus any external directories and files optionally specified in the configuration. Corda assumes the filesystem is reliable. You must ensure that it is configured to provide this assurance, which means you must configure it to synchronously replicate to your backup/DR site. If the above holds, Corda components will benefit from the following:
- Guaranteed eventual processing of acknowledged client messages, provided that the backlog of persistent queues is not lost irremediably.
- A timely recovery from deletion or corruption of configuration files (e.g.,
node.conf,node-infofiles, etc.), database drivers, CorDapps binaries and configuration, and certificate directories, provided backups are available to restore from.
警告
Private keys used to sign transactions should be preserved with the utmost care. The recommendation is to keep at least two separate copies on a storage not connected to the Internet.